Dear Friends,
Every time we run into query performance issues one very basic but important question strikes in our mind that; how the query SQL Server execution plan looks like? A query execution plan is query optimizers attempt to calculate the most effective way to implement every query request represented by Transact SQL statements that we submit. A query execution plan is very important from DBA point of view when troubleshooting poor performing queries as they tell you how a query is executed or will be executed.
It is very important to get familiar with different operators (represented as ICONS) that are shown in execution plans in order to understand them correctly before troubleshooting anything. I thought of writing a series on some basic but important execution plan operators which may be helpful to us when we start interpreting them in real life scenarios. It is not possible to cover everything in a blog post or two and even a series however I’ll try to cover as much as possible which may help us to understand how do we interpret graphical execution plans with sample T-SQL queries.
Before I start my demonstration on different plan ICONS, I believe we will have to get ourselves acquainted with what are operators? MSDN describes Operators as following;
Operators describe how SQL Server executes a query or a Data Manipulation Language (DML) statement. The query optimizer uses operators to build a query plan to create the result specified in the query, or to perform the operation specified in the DML statement. The query plan is a tree consisting of physical operators. You can view the query plan by using the SET SHOWPLAN statements, the graphical execution plan options in SQL Server Management Studio, or the SQL Server Profiler Showplan event classes.
These operators can be either logical or physical, which we will have a look later parts of this series. Complete list of operators is available here on MSDN.
Today we will kick start this series with Clustered Index Scan with a simple query, here we go;
Clustered Index Scan
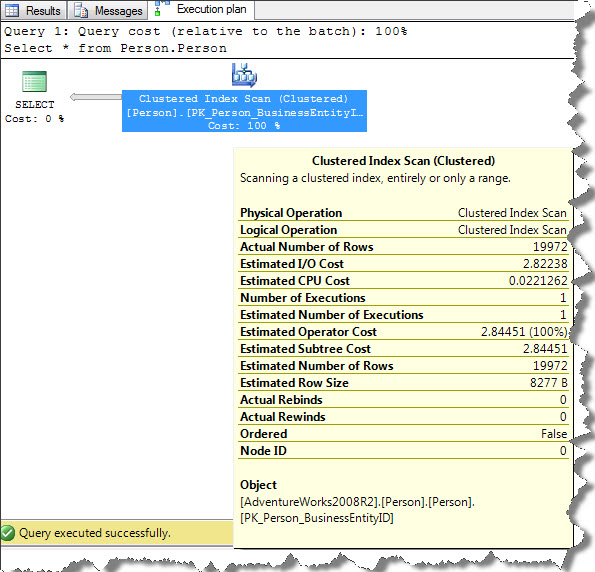
You can observe that clustered index scan operation performed to retrieve requested result set. When you place mouse pointer to Clustered index scan icon it show index key PK_Person_BusinessEntityID used to fetch result set and estimated number of rows are 19972. Clustered index not only stores key structure but also sort and stores data. So, clustered index scan is almost same as table scans. When we look at Ordered option shown in ToolTip, this is set to False here. Entire index is scanned through row-by-row in order to retrieve result-set which is not an efficient way and may impact overall query performance. We can think about using appropriate predicates in WHERE clause to limit query result as per our requirements.
Stopping here today, in my next post I’ll illustrate some more operators. Stay tuned, I will be back with next part soon.
Regards
Kanchan Bhattacharyya
Like us on FaceBook | Follow us on Twitter | Join the fastest growing SQL Server group on FaceBook
Follow me on Twitter | Follow me on FaceBook