Hello Geeks and welcome to the Day 11 of the long series of One DMV a day. In this series of blogs I will be exploring and explaining the most useful DMVs in SQL Server. As we go ahead in this series we will also talk about the usage, linking between DMVs and some scenarios where these DMVs will be helpful while you are using SQL Server. For the complete list in the series please click here.
We have seen how to find out what is using up space in TempDB using the DMVs in the last three days blogs. Today I will be starting with the most critical and useful DMVs in SQL Server. The SQL Server Operating System related DMVs. I will start with the simplest one which often is not used or not known to many Junior DBAs. Off course all seasoned DBAs would have used it many times. It is sys.dm_os_performance_counters.
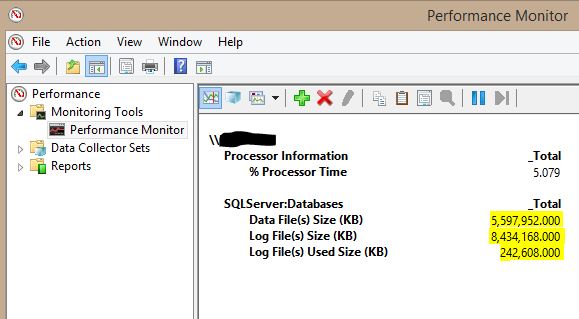
sys.dm_os_performance_counters exposes the Windows level counters which you see when you open perfmon.

The DMV is straight forward in using. To see data in this DMV the performance counters should be enabled. You will see 0 as the output if this is not enabled and the error 3409 in the error log – “Reinstall sqlctr.ini for this instance, and ensure that the instance login account has correct registry permissions.” You will see the actual error just before his error message. If it is really the problem with enabling you can enable the performance counters by following below steps.
- Stop SQL Instance.
- In command prompt go to binn directory of the SQL Instance (eg: <drive>:\Program Files\Microsoft SQL Server\MSSQL12.<Instance>\MSSQL\Binn).
- Type command “lodctr sqlctr.ini” and run it.
- Start SQL Instance and you should start seeing the data.
Sys.dm_os_performance_counters returns one row for each counter and has the information of the counter category, counter name, instance name, counter value and counter type. The counter value is cumulative for the per-second counters. The below query will return the results which are shown in the above screenshot of the perfmon.
SELECT * FROM sys.dm_os_performance_counters
WHERE counter_name LIKE '%Size (KB)%'
AND instance_name = '_Total'

Sys.db_os_performance_counters can be used for many other troubleshooting and monitoring cases. You can setup an alert based on the percent log used counter by setting a threshold to send mails or track the trend. We use perfmon counters in our environment for tracking growth of files. This helps us in capacity planning.
Tomorrow I will talk about another OS related DMV. So, stay tuned. Till then
Happy Learning,
Manu
Like us on FaceBook | Join the fastest growing SQL Server group on FaceBook |
Follow me on Twitter | Follow me on FaceBook
