In today’s blog post, you will be reading about the CXPACKET Wait Type in SQL Server. Three primary things that we will be looking into are:
- What is CXPACKET Wait Type?
- When does it occur?
- And some possible solutions (if at all the wait times are very high)
CXPACKET stands for Class eXchange Packet. This wait type occurs when the query or workload is running in parallel, with more than one thread being used by SQL Server database engine to execute the query. The controller thread having an id of 0 will register for the CXPACKET wait type and create multiple threads to execute the query.
The presence of CXPACKET wait type is a confirmation that parallelism is happening. This is good and usually not a problem. But when the wait time for the CXPACKET wait type increases significantly (in comparison to a baseline value), there may be some investigation required and, some tweaking can be done.
By default, Cost Threshold of Parallelism (CTP) has a value of 5. If the query cost exceeds this value, then SQL Server will decide to choose a parallel plan, thereby causing multiple threads to execute the query. There is a downside to this. With such a low value, even low-cost queries will be executed using multiple threads, which is inefficient. Not only does this become more resource consuming but may also lead to a thread starvation situation on systems with few processors.
When you observe this “unwanted parallelism”, it is important to keep in mind not to set MAXDOP – (Maximum Degree of Parallelism) to 1. This will result in parallelism being disabled. Disabling parallelism is not a good idea. Instead, you may want to consider tweaking cost threshold of parallelism to a higher value and fine tune further. This causes the low-cost queries to run in serial using a single thread and, as a result, the CXPACKET wait time will drop noticeably.
Let us dive into a simple example to better understand these concepts. For the purposes of this demo I am using AdventureWorks2008R2 database.
Turn ON STATISTICS TIME & STATISTICS IO to obtain run time statistics of the query. The current wait time for CXPACKET is observed by executing a ‘SELECT *’ statement on the DMV – sys.dm_os_wait_stats, with a filter on CXPACKET, as shown below.
USE AdventureWorks2008R2
GO

SET STATISTICS TIME ON
SET STATISTICS IO ON

SELECT * FROM sys.dm_os_wait_stats
WHERE wait_type = 'CXPACKET'
You can observe the current numbers but we will clear that in the next step.

For the purposes of the demo, the wait_stats are cleared using the ‘DBCC SQLPERF’ command.
DBCC SQLPERF ('sys.dm_os_wait_stats', CLEAR)
(Please Note: This is not advisable on a production environment)
Once cleared, the query returns zero for all columns.
Turn on Actual Execution Plan and execute the SELECT query.
-- Turn On Actual Execution Plan
SELECT * FROM Sales.SalesOrderDetails
ORDER BY LineTotal DESC
GO
Jump over to the execution plan and you can see that parallelism is taking place. Observe the iterators with arrow symbol.

Let’s investigate further with the Clustered Index Scan operator. Select, right click, Properties. In the Properties window, the field titled Actual number of Rows displays the number of threads that were used to process the data. Click on +.
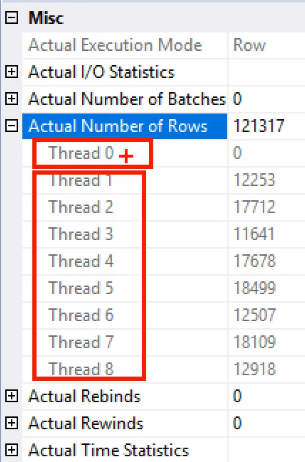
As mentioned earlier, Thread 0 is the controller thread, while the following eight threads execute the task.
When the execution begins, parallelism occurs and Thread 0 registers for CXPACKET. If any of the child threads complete before the others, they too will be waiting on CXPACKET.
You can see the query cost by hovering the cursor over the SELECT operator. Cost being 4.37091. Note that this is the cost of the query when it is running in parallel.
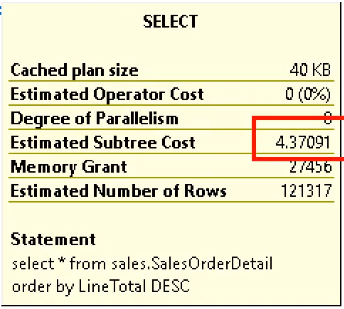
Now lets find out the cost of the query when it is serial. We will run the same query with the MAXDOP hint. 1 here tells SQL Server to run the query with a single thread.
-- Turn On Actual Execution Plan
USE AdventureWorks2008R2
GO
SELECT * FROM Sales.SalesOrderDetails
ORDER BY LineTotal DESC
OPTION (MAXDOP 1)
GO
Now the execution plan has serial iterators (no arrows).

The cost of the query is 10.4921, which is higher than the CTP value of 5, therefore, SQL Server parallelizes the execution.
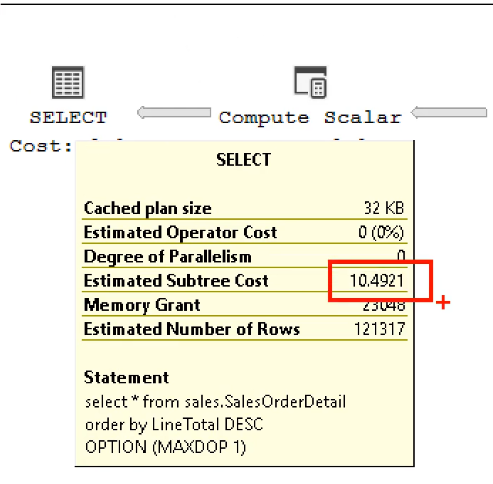
Let’s check out Cost Threshold of Parallelism configuration.
SP_CONFIGURE 'Show advanced option', 1
GO
RECONFIGURE
GO
SP_CONFIGURE 'cost threshold for parallelism'
The config_value and the run_value is 5.

Let’s change the value to 11.
SP_CONFIGURE 'cost theshold for parallelism', 11
GO
RECONFIGURE
GO
Now, if we run the query again without the MAXDOP hint, you will see that there is no parallelism.
-- Turn On Actual Execution Plan
USE AdventureWorks2008R2
GO
SELECT * FROM Sales.SalesOrderDetails
ORDER BY LineTotal DESC
OPTION (MAXDOP 1)
GO

The cost of the query running in serial has a value of 10.4921.
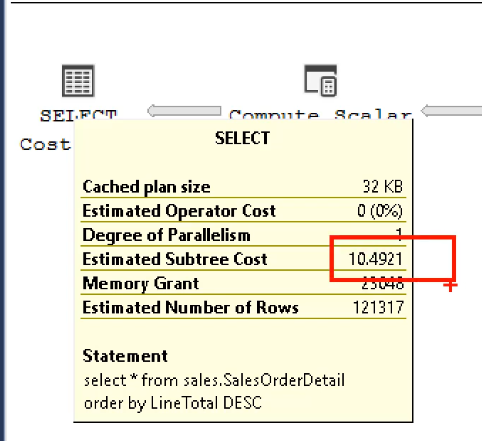
For the sake of experimentation, the value of ‘cost threshold of parallelism’ is changed back to 5.
SP_CONFIGURE 'cost threshold for parallelism', 5
GO
RECONFIGURE
GO
Next, the two queries are executed simultaneously to observe the relative cost of each query to the overall plan cost. The first query will run in parallel and the second one will not.
In the first case, the optimizer will choose 8 threads and in the second, it will choose 4.
SELECT * FROM Sales.SalesOrderDetails
ORDER BY LineTotal DESC
GO

USE AdventureWorks2008R2
GO
SELECT * FROM Sales.SalesOrderDetails
ORDER BY LineTotal DESC
OPTION (MAXDOP 4)
GO
After execution, the following Execution Plan is obtained.
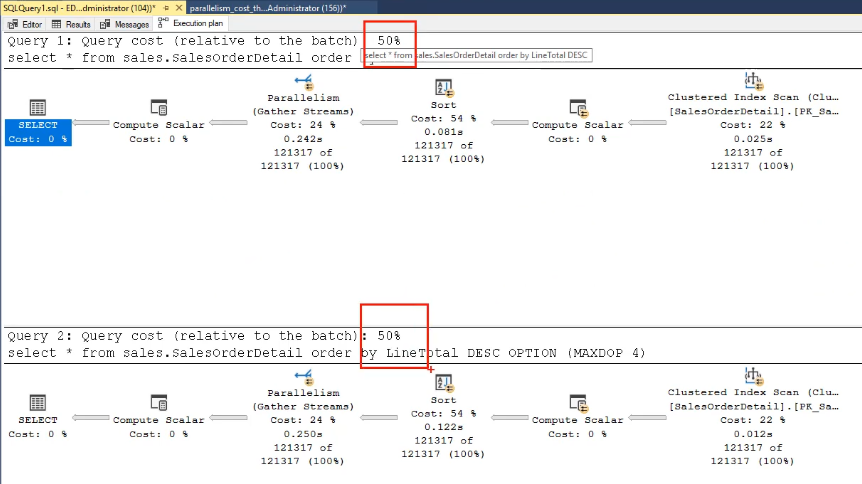
From the optimizer’s point of view, the Execution Plan is identical for both queries and the cost factor too remains the same. In the Messages tab, looking into the Run Time Statistics. The CPU Time and Elapsed Time for both executions are almost similar (negligible difference).
First query:
CPU Time: 891 ms
Elapsed Time: 2044 ms
Second query:
CPU Time: 891 ms
Elapsed Time: 2033 ms
To take this one step further and ensure that it is indeed running on one thread only the value of MAXDOP is changed back to 1 and both queries (shown below) are executed once again.
SELECT * FROM Sales.SalesOrderDetails
ORDER BY LineTotal DESC
GO

USE AdventureWorks2008R2
GO
SELECT * FROM Sales.SalesOrderDetails
ORDER BY LineTotal DESC
OPTION (MAXDOP 1)
GO
After execution, the following results are observed.
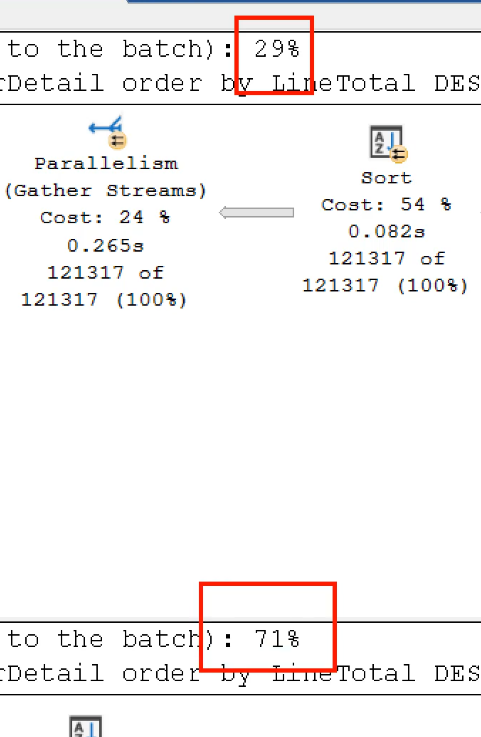
There is a noticeable difference in performance with respect to the query cost. The query with a parallel plan of 8 threads is less expensive than the one being run in serial.
However, the Run Time Statistics provides more details as shown below and, gives the other side of the coin:
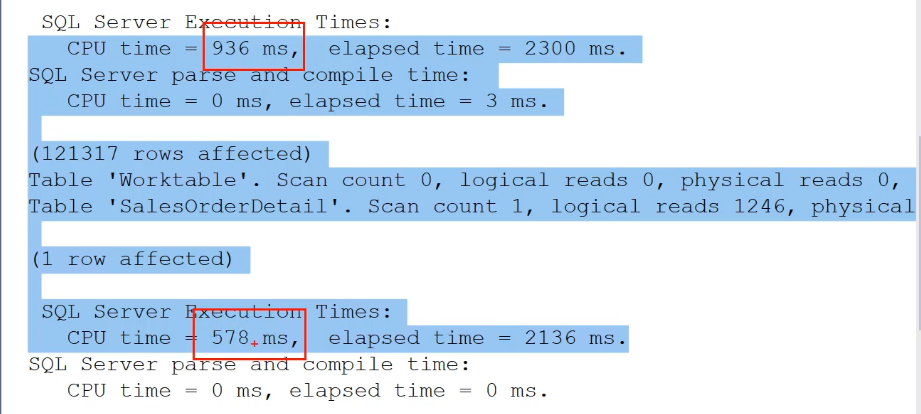
It is clear that there are certain queries that are much more efficient when run on a single thread whereas others do indeed benefit from parallelism.
Another tip: always check and compare runtime stats.

Hi, thank you for your post
I wondered when I opened my “actual number row” I just see all threads and I can’t find degree of parallelism in my yellow window.