In today’s blog we will be looking into Performance Monitor Counters. Database Administrators involved in troubleshooting SQL Server performances have indeed come across this topic at some point of time. The Windows OS contains the Performance Monitor Tool that allows us to add counters and then analyse real-time statistics, either using the numbers or the Graphical User Interface. Since this is a Windows Tool, it may not be available for DBAs on a production environment.
In SQL Server, the DMV sys.dm_os_performance_counters provides the values of these counters required during troubleshooting a production environment. It is to be noted that when a ‘select *’ statement is run on this DMV, it returns the current values for the counters. Here, we will be looking into a technique on how to store the output of this DMV in a baseline database, run it frequently and proceed to plotting, charting and so on. This data is as good as that provided by the Windows Performance Monitor tool.
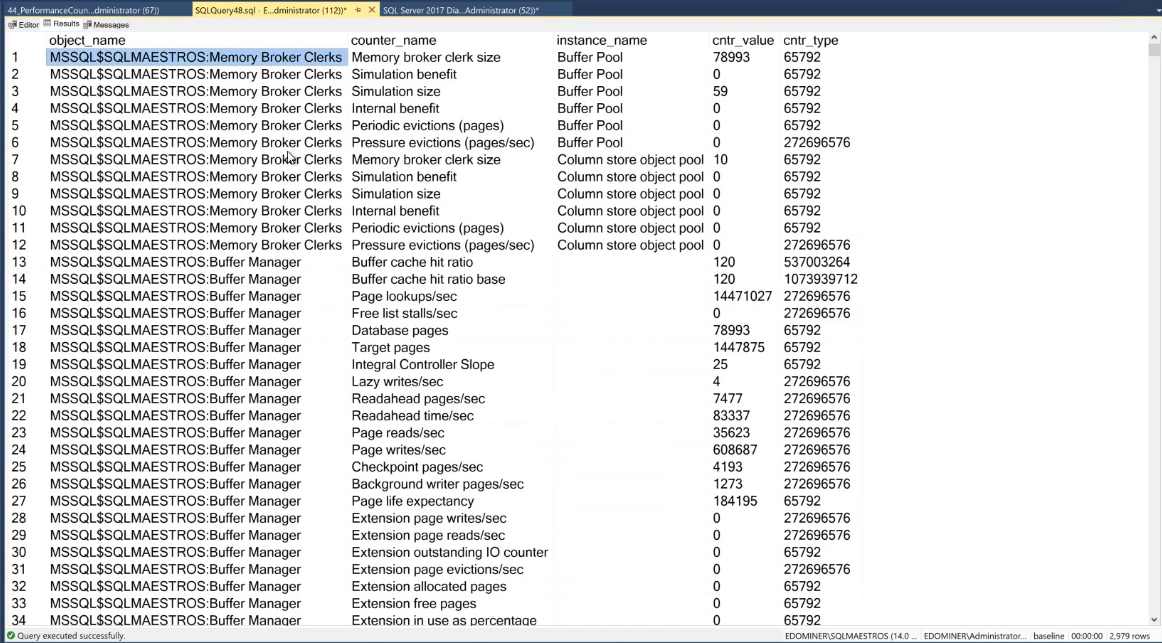
Firing up the DMV with a ‘select *’ statement, the following results are observed. There are 2979 records, all of which are SQL Server counters.
SELECT * FROM sys.dm_os_performance_counters

The cntr_value column represents the value of the corresponding counters at the instance that the DMV was run. Real time monitoring is not something that can be performed from within SQL Server Management Studio. The work around to this is the concept of Baselining– i.e., to record data on a periodical basis and analyse the pattern of values over a period of time.
Storing this entire data is not possible/required. Thus, it is necessary to filter down on some specific counters, depending on what we plan on troubleshooting.
The image below gives a glimpse of some home-cooked code, used for Baselining. It begins with the creation of a table with two columns namely – collection_id and collection_time, and a few additional columns that will be required.
From this DMV, the values of Counter, CounterType and CounterValue are recorded in the table. With every execution the data will be recorded accompanied by an increment in the value of collection_id. This will help keep a track of – the id, which is the collection point and the time at which it was recorded.
IF OBJECT_ID('baseline..PerformanceCounters') IS NULL
BEGIN

CREATE TABLE [dbo].[PerformanceCounters](
    [collection_id] [int] NOT NULL,
    [collection_time] [datetime] NOT NULL,
    [ServerName] [nvarchar](128) NULL,
    [Counter] NVARCHAR(770),
    [CounterType] INT,
    [CounterValue] DECIMAL(38,2),
    );

INSERT baseline..PerformanceCounters
SELECT 1 as collection_id, GETDATE() as collection_time, @@SERVERNAME as ServerName,
    RTRIM([object_name]) + N':' + RTRIM([counter_name]) + N':' + RTRIM([instance_name]),
    [cntr_type],
    [cntr_value]
FROM sqlmaestros.dm_os_performance_counters
WHERE [counter_name] IN (
    'Page life expectancy', 'Lazy writes/sec', 'Page reads/sec', 'Page writes/sec','Free Pages',
    'Free list stalls/sec','User Connections', 'Lock Waits/sec', 'Number of Deadlocks/sec',
    'Transactions/sec', 'Forwarded Records/sec', 'Index Searches/sec', 'Full Scans/sec',
    'Batch Requests/sec','SQL Compilations/sec', 'SQL Re-Compilations/sec', 'Total Server Memory (KB)',
    'Target Server Memory (KB)', 'Latch Waits/sec'
    )
ORDER BY [object_name] + N':' + [counter_name] + N':' + [instance_name];

END
ELSE
BEGIN

INSERT baseline..PerformanceCounters
SELECT TOP(50) (select isnull (max(PerformanceCounters.collection_id),0)+1 from PerformanceCounters) as collection_id, GETDATE() as collection_time, @@SERVERNAME as ServerName,
RTRIM([object_name]) + N':' + RTRIM([counter_name]) + N':' + RTRIM([instance_name]),
    [cntr_type],
    [cntr_value]
FROM sqlmaestros.dm_os_performance_counters
WHERE [counter_name] IN (
    'Page life expectancy', 'Lazy writes/sec', 'Page reads/sec', 'Page writes/sec','Free Pages',
'Free list stalls/sec','User Connections', 'Lock Waits/sec', 'Number of Deadlocks/sec',
    'Transactions/sec', 'Forwarded Records/sec', 'Index Searches/sec', 'Full Scans/sec',
    'Batch Requests/sec','SQL Compilations/sec', 'SQL Re-Compilations/sec', 'Total Server Memory (KB)',
    'Target Server Memory (KB)', 'Latch Waits/sec'
    )
ORDER BY [object_name] + N':' + [counter_name] + N':' + [instance_name];

END
The following image shows a few counters that have been chosen for the purposes of this blog. The code shown below is executed.
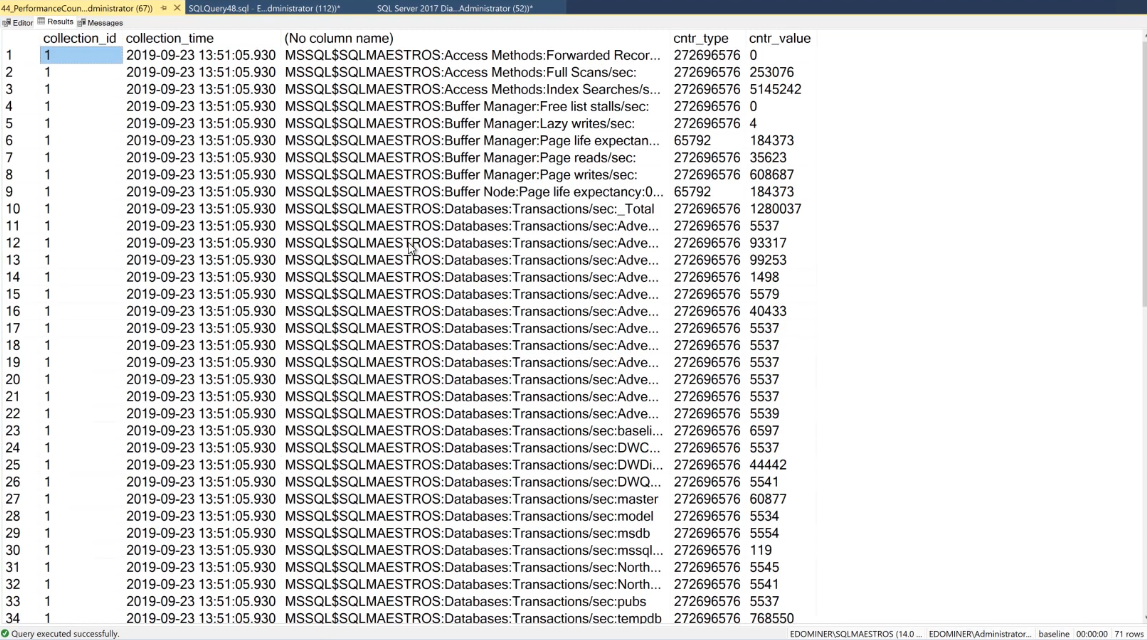
Upon doing so, the results display multiple columns. Here, the object/counter are concatenated to obtain the records for the third column, whereas the fourth and fifth comprise of data relating to counter type and its corresponding value, at that instance level at this moment.

Multiple executions of the script create the table (if needed) and then inserts the data. This is evident by the presence of collection_id – 2, 3 and 4, further down the list.
In this way the data from Performance Monitor Counters can be collected from within SQL Server for purposes of trend analysis.
To conclude, there are indeed performance monitor counters made available to us using the DMV- sys.dm_os_performance_counters which can be put to great use once we Baseline the data. This allows us to observe the changes over a span of time, giving better insight during our troubleshooting endeavours. Once we have a grasp of the counters, they must be filtered upon for optimum results.
