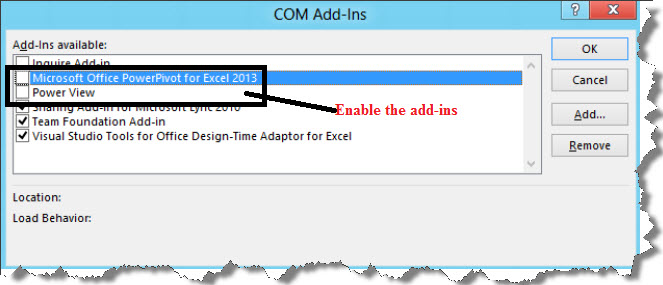
In Excel 2013, much of that functionality, including the infrastructure that supports it, is built directly into the Data Model in Excel. Without installing a separate add-in, PowerPivot and PowerView add-ins are installed by default. But they are not automatically enabled. You have to do some menu/dialog box acrobatics to turn them on, but it’s a one-time set-and-forget requirement.
If you’d like to try it yourself, click through File|Options|Add-Ins|Manage COM Add-Ins|Go… and then enable the add-ins by checking them off and clicking OK.
Below diagram will give you more idea.

Some of the Excel 2013 Features:
If you are looking to quickly build out a self-service BI solution that tells the story of your data, you can now use the tool you know and love – Excel – to rapidly mash-up, explore, analyze and visualize any data ranging from a few rows to hundreds of millions of rows.
- xVelocity in-memory analytics:
Analyze data ranging from a few rows to hundreds of millions of rows instantly on your desktop using Excel data models, new in 2013 powered by xVelocity in-memory analytics engine. More Details
- Quick Explore, Trend Charts, Quick Analysis and Flash Fill:
Improve productivity by easily shaping your data with Flash Fill; using Quick Analysis to preview and apply conditional formatting, suggest and create charts, PivotTables, and tables; and using Quick Explore to easily navigate multidimensional and tabular data models and create Trend charts to analyze information over time.
- Power Pivot:
Access,mash-up and analyze data from virtually any source and rapidly create compelling analytical models with PowerPivot, now in Excel.
- Power View:
Provide stunning data visualization to discover new insights with a highly interactive and familiar data exploration, visualization, and presentation experience with Power View, now in Excel.
Regards
Suhas Kudekar
Like us on FaceBook | Follow us on Twitter | Join the fastest growing SQL Server group on FaceBook
Follow me on Twitter | Follow me on FaceBook
