Hi Friends,
This is my first Blog post on SQL Server 2016 CTP2 and 100th on SQLServerGeeks.com. Yes, I have completed my first century of blogs with this blog post.
Today, I am going to show you a new feature of SQL Server 2016 CTP2 Live Query Statistics. Till SQL Server 2014, we have seen the Execution Plans before the execution of Query i.e. Estimated Execution Plan and Post Execution Plan i.e. Actual Execution Plan. Now in SQL Server 2016, you can view the live execution plan in between of query execution. Now with this new feature, you can view graphically which operator has been completed and which operator is processing the data right now. Here I have mention the word graphically because you can also view this information in SQL Server 2014 by using DMV sys.dm_exec_query_profiles. If you want to know more about this DMV then you can click here. You can enable this new feature Live Query Statistics for your query in SQL Server 2016 Management Studio by clicking on the icon as shown in below image. (Next Right Icon to Actual Execution Plan)
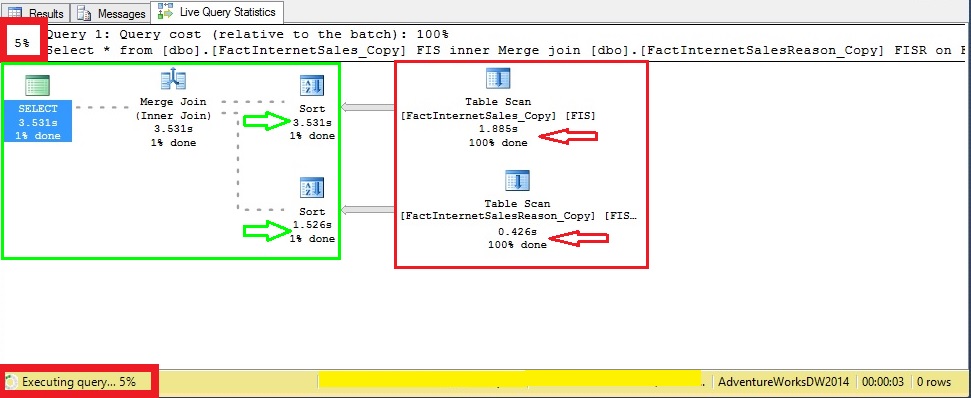
You can also enable this option with right click in your query window then click on Include Live Query Statistics option. In my conception this option can help a lot for troubleshooting the long running queries. I tried to create a long running query on AdventureWorksDW2014 database after creating some tables with test data. In the below image you can see the query execution plan while it is in between of the execution.
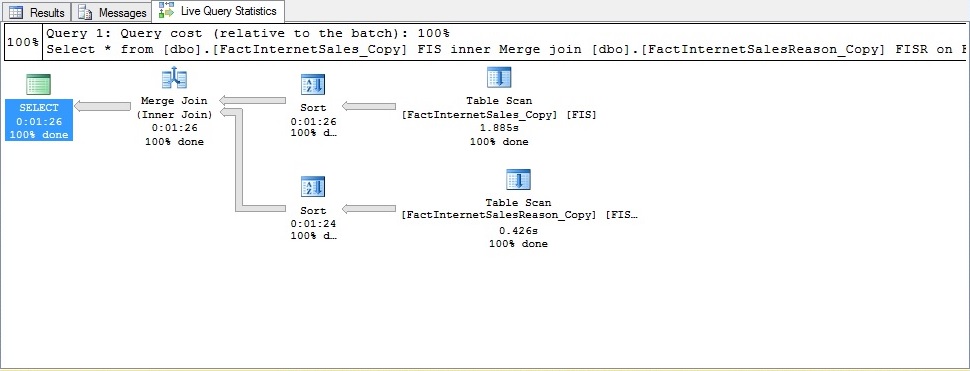
From the above image you can find out the operators which are down with their tasks as highlighted in Red box. While the in process operators are highlighted in Green box. You can also view the x% done values for each operator. Below is the image while my query execution completed.
HAPPY LEARNING!
Regards:
Prince Kumar Rastogi
Like us on FaceBook | Join the fastest growing SQL Server group on FaceBook
Follow Prince Rastogi on Twitter | Follow Prince Rastogi on FaceBook


Congrts for 100th post on SQLServergeeks.com
Thank You Suman Jha!