Hello Friends,
There are lots of features and improvements announced by Microsoft in SQL Server 2016, one of them is adding new columns in sys.dm_exec_query_stats. These new columns capture information about threads and memory. First, I’ll show you the new added columns for collecting threads and Degree of parallelism level information.
Select * from sys.dm_exec_query_stats
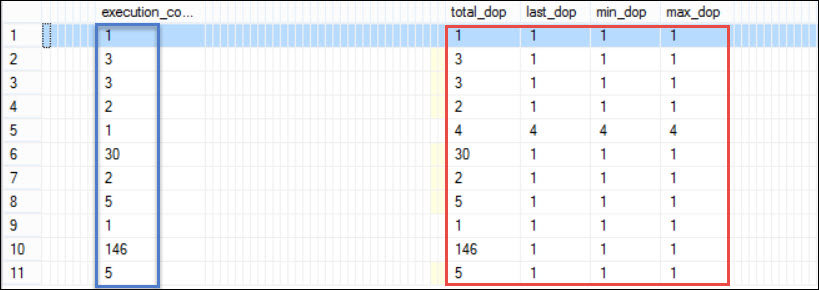
Here total_dop represent the total degree of parallelism used after the plan compilation. In the similar way you also have the information about the degree of parallelism for the last execution (last_dop), minimum and maximum degree of parallelism used in a query (min_dop and max_dop). In the first image above, you can see that all rows except row number 5, run with serial plans while row number 5 run with a parallel plan where MAXDOP used is 4.
We know that similar to other resources, SQL Server also reserved threads for query execution. You can see all such thread level information from columns shown in the second image. This information will play a very important role during the troubleshooting of thread level issues like when a single query plan reserved lots of threads while using very less.
Another important section is for about memory grant and memory uses. As shown in below image:
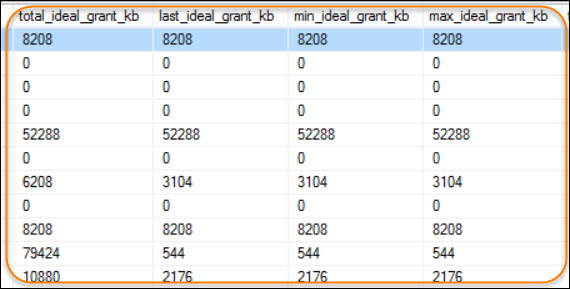
In the above image, the first section is showing the information about total memory grant since plan compilation, memory grant for last execution, minimum and maximum memory grant in kb. Second section has shown the information about the actual memory uses since last plan compilation, memory used for last execution, minimum and maximum granted memory used. Below are the columns which will give you the information about the ideal memory grant.
Where Ideal Memory = Required Memeory * DOP + Additional Memory.
HAPPY LEARNING!
Regards:
Prince Kumar Rastogi
Like us on FaceBook | Join the fastest growing SQL Server group on FaceBook
Follow Prince Rastogi on Twitter | Follow Prince Rastogi on FaceBook


very good dear …..its a nice idea. congratultaion.