Hi Friends,
In my previous 2 posts in this series, I demonstrated how you can explore the Shape files & how you can import shape files in SQL Server databases. You can find both the posts here:
In this post, I will demonstrate how you can use the Map Layer control in Reporting Services 2008 R2.
Introduction:
Map Wizard and Map Layer Wizard adds maps and map layers to your report to visualize spatial data against a spatial geographic background. A map gallery of US maps gets installed by default when you install Reporting Services R2. In case you want to work with other countries, you can use ESRI shape files. Thus, when using a map layer, it can display spatial elements from a map in the Map Gallery, from a SQL Server query that returns SQL Server spatial data (from a database), or from an Environmental Systems Research Institute, Inc. (ESRI) shapefile that you learnt about in previous posts. Map data can be polygons that represent areas, lines that represent paths or routes, or points that represent locations such as stores or cities. You can also add a display background based on Microsoft Bing Maps.
You can modify each layer to control color, size, width, or marker type. For example, you can add a bubble map that varies bubble size for store locations based on sales or a color analytical map that displays customer demographics for geographic regions . You can add labels, legends, titles, a color scale, and a distance scale to help your users interpret the map display. You can add interactive features such as tooltips and drillthrough links, or provide parameters that enable a user to interactively control the visibility of each layer – in a nutshell, you can visualize the map the way you want with lots of flexibility.
Let’s get started:
First, download & import the following map of Australia in a SQL Server database called Australia. You can download the map of Australia from http://www.vdstech.com/map_data.htm & follow my earlier blog post to see how you can import the shape file: https://www.sqlservergeeks.com/sql-server-learning-spatial-stuff-importing-shapefiles-in-sql-server-database//a>
Second, make sure you have the AdventureWorks2008R2 sample database. If not, download it from codeplex.
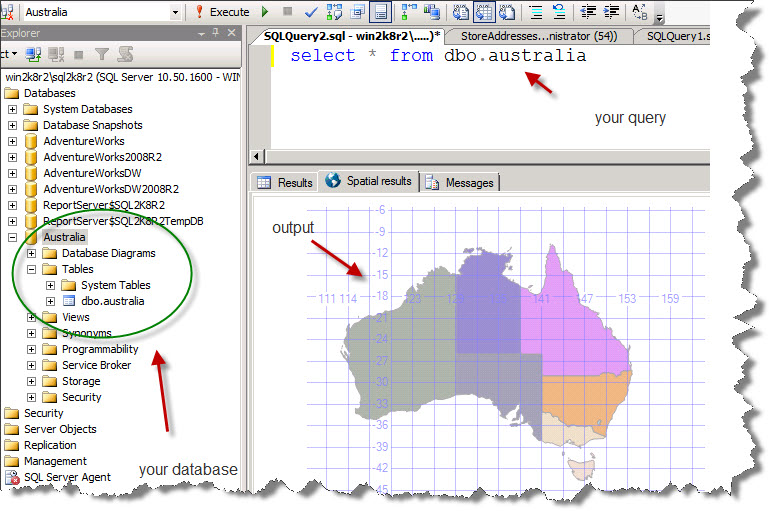
Once you have the Australia database ready, you should be able to run the following query and get the following output:
Once you have the AdventureWorks2008R2 database ready, you should be able to run the following query and get the following output:
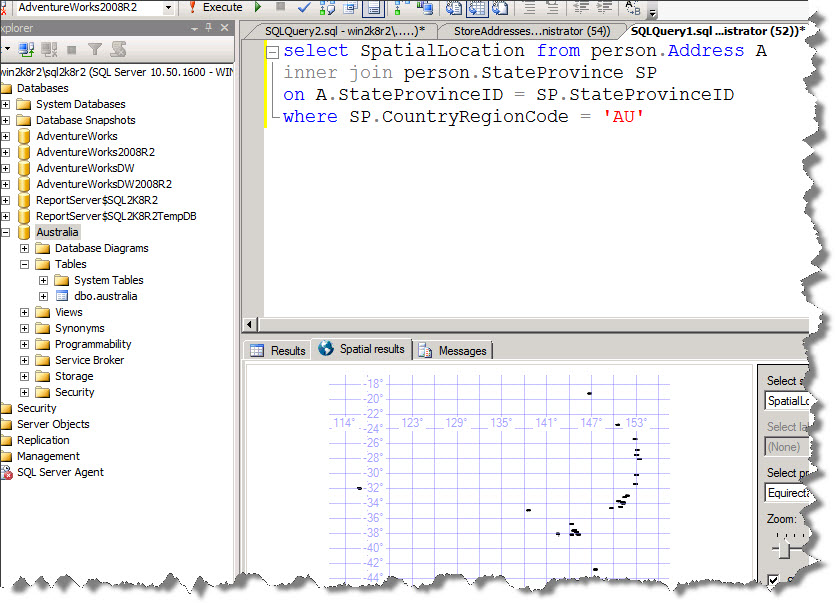
The query is:
USE ADVENTUREWORKS2008R2
GO

select SpatialLocation from person.Address A
inner join person.StateProvince SP
on A.StateProvinceID = SP.StateProvinceID
where SP.CountryRegionCode = 'AU'
GO
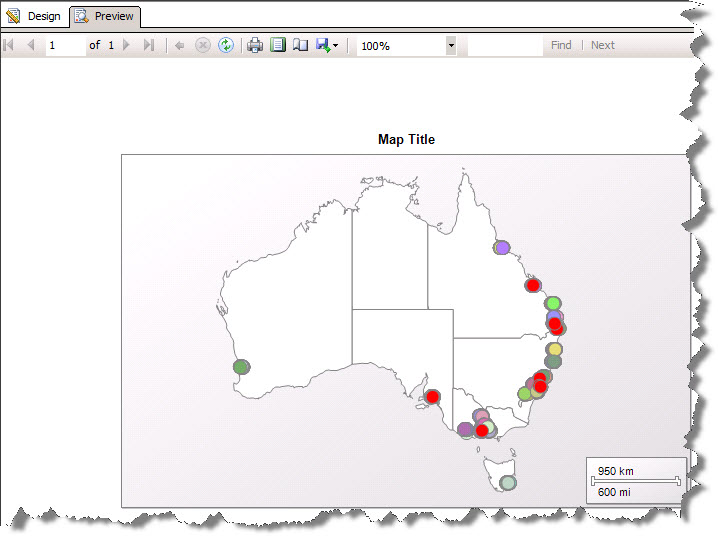
SO, you are already getting a hint as to what we are trying to do 🙂 – yes, if you look at the above query you can see that I am retrieving all the persons who live in Australia and I shall map them on Australia map. So, we are going to have 2 layers, the Australia map provides the background and the above spatial query provides the data to be mapped on the background.
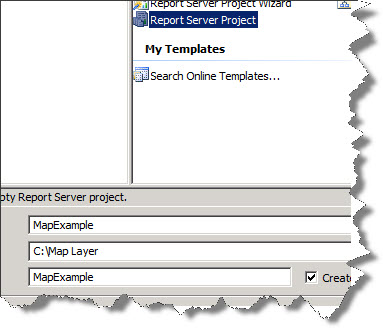
Start BIDS and create a new SSRS project.
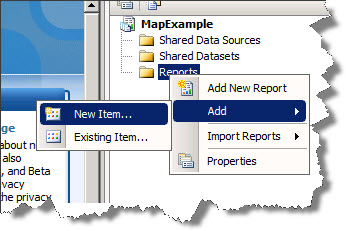
Add a new Report Item, say MapReport.rdl
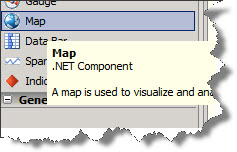
From the toolbox, drap and drop the Map control on the surface of the report. The wizard starts automatically.
You can choose the source of spatial data. We shall choose SQL Server Spatial Query. Click Next
Select Add a New DataSet. Click Next
Click New to create a new Data Source (as we do not have any DS in our project yet)
You can give whatever name you want to the DS. Click on Edit to specify the connection settings. Specify the server name and instance name. Choose Australia database since we shall first create the background layer. Your settings should look like this:
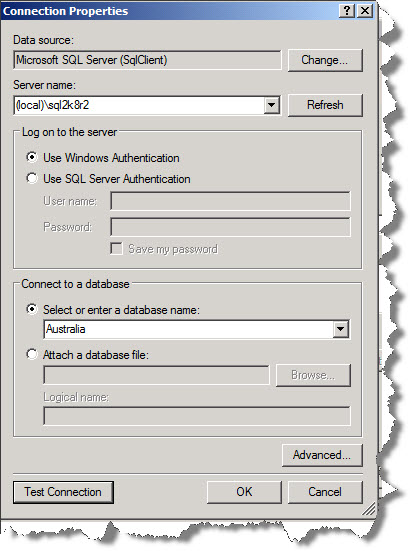
Click OK
Click OK again.
Back to the wizard, click Next.
In the Design the query page, put down your query: SELECT * from Australia
Click Next. This is what you should get:
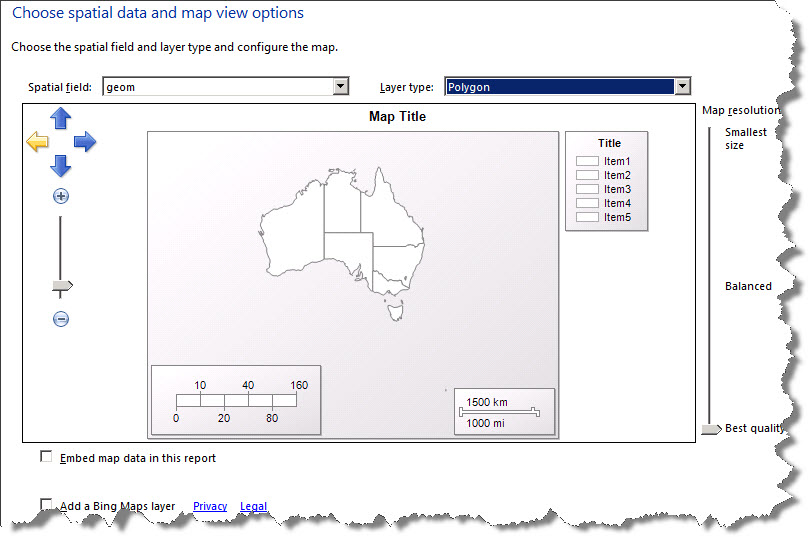
Spatial filed is automatically selected. Layer type should be Polygon in our example.
You can embed this data in the rdl file itself. This will make rendering fast but will increase the size of the RDL file.
You can also add a Bing Map layer if you wish so.
Zoom & pan the map to fit it in the box. Something like this:

Once you are done adjusting, click Next.
Select Basic Map. Click Next.
Let us keep the theme as generic. We shall go with Single color map since we want our plottings to be colored.
Click Next. Oops, click Finish 🙂
You can see the Australia Map comes up on the surface. We now need to add another layer on top of this which will plot the next query on this layer.
Click anywhere on the blank surface and double click on the map to activate the map layer context menu, see below:
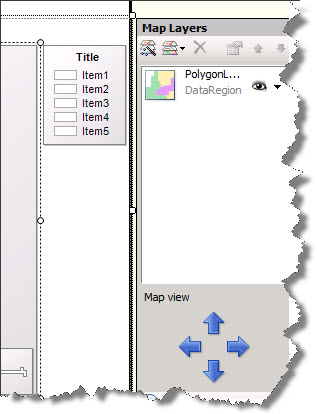
One the Map Layers toolbox is shown, click on the first toolbar icon to start the layer wizard again:
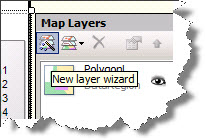
On the wizard, select SQL Server Spatial Query, click Next.
Add a New DataSet, click Next.
Click on New to create a new Data Source. Click on Edit to specify the connection settings. This time choose AdventureWorks2008R2 database.
Click OK twice to come back to the same page and click Next.
In the Design a Query page, put down the following query:
select SpatialLocation from person.Address A
inner join person.StateProvince SP
on A.StateProvinceID = SP.StateProvinceID
where SP.CountryRegionCode = 'AU'
GO
Click Next.
You can see the points being plotted on the map. Pan & Zoom to adjust, as done previously.
Click Next.
Select Basic Marker Map. Click Next.
Uncheck Single Color Map. This will make the plotting colorful 🙂 – the output should look like this:

Click Finish. And you are done 🙂
Click on the Preview tab and your report should render like this.
Hope you enjoyed this post. Do tweet and FB share and let more people know how to work with Map layers.

Hi Amit, many thanks for sharing this new thing. I am still working on ssrs 2005 so couldn’t get a chance to explore these new features of R2. But I am really excited to try this example asap. Telecom companies can get a very good advantage of this new features to find out their competitors on map.
Glad you liked it 🙂
Hi Amit, really a nice one and I have also tried the same for US data by downloading the US map from the site you have suggested.
But I am curious to know, “Is there any relation between the layers or they simply ovetlap based on the coordinates in the shape data. I mean how come the addresses in Australia show over the correct map area.”