In today’s blog, we are going to be talking about Buffer Pool Usage. This is the first of many blogs we will be creating about SQL Server Memory Troubleshooting. This blog is inspired by a very common question that comes up in forums where we find DBAs complaining about SQL Server hogging up memory.
The first thing we need to understand is SQL Server loves memory, as it allows it to cache a large number of data pages and index pages in memory so that they can be served faster to the clients when required. Our prime objective is to find out which aspect of SQL Server is consuming memory. It’s a common observation that Buffer Pool consumes the most amount of memory as it is primarily responsible for storing the data and index pages.
Let us attempt to understand the concept of Buffer Pool usage. First, we will have to figure out overall Server Memory and then narrow down on which component is consuming the maximum amount of memory, and then attempt to break down the buffer pool memory into databases and objects which will give us a clearer understanding of which object under which specific database is responsible for memory consumption.
Before we jump into buffer pool usage and the different DMVs including buffer descriptors, we hop over to Performance Monitor which accurately tells us the Total SQL Server Memory. Total Server Memory is inside the object ‘Memory Manager’. To get here, we need to traverse into the server’s name, then into the named instance which contains the object Memory Manager with details of storage used.

Next, we have a DMV that will show us the memory usage by the buffer pool and the break-up of the memory into databases and objects.
SELECT *
FROM sys.dm_os_buffer_descriptors
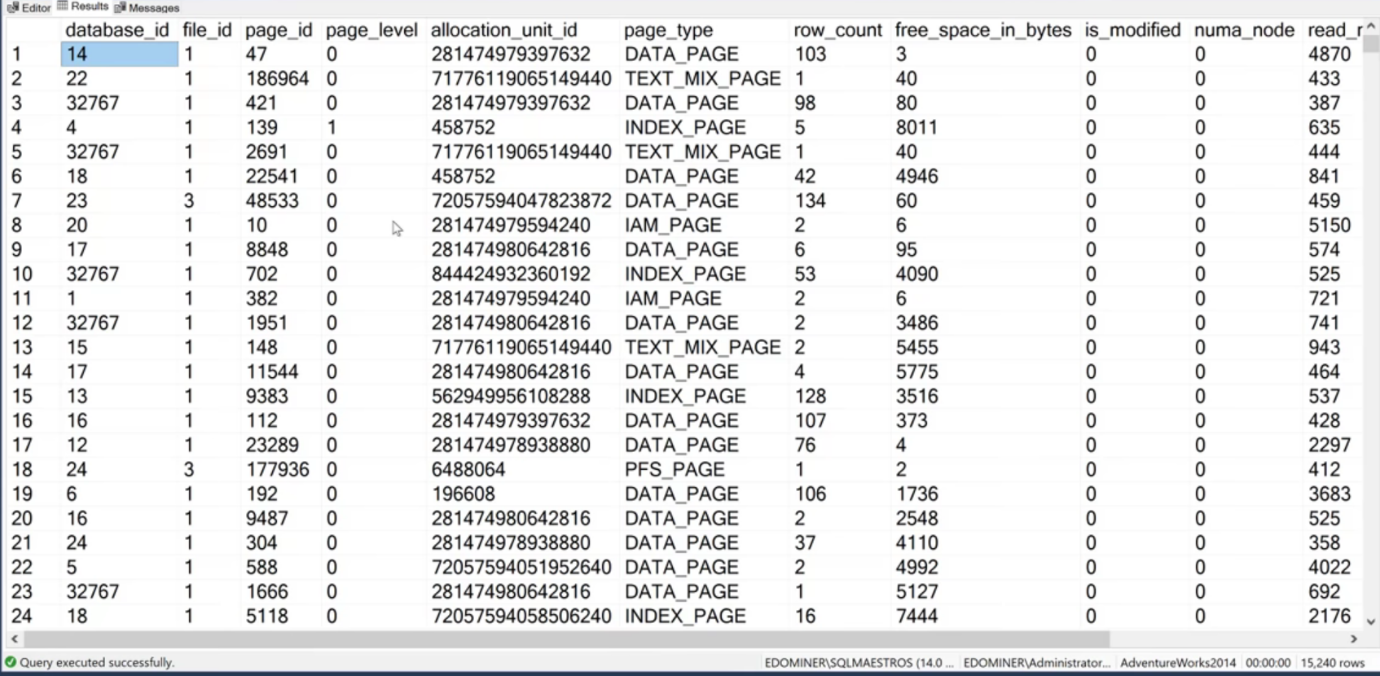
Upon executing the above query, we see the following results.

This DMV has one record for each page, and if we look at the bottom right, we see that there are about 15000 pages in this database and the query provides us with a description of each page and various information such as the file_id, page_id, which database it belongs, the type of page it is, so on and so forth.
Next, we need to see how this bulk data is assorted to find out how much memory is being consumed by Buffer Pool. We have a query containing a DMV namely sys.dm_os_process_memory which also gives us some details regarding the total server memory. The query and its corresponding output look something as follow.
SELECT physical_memory_in_use_kb / (1024) AS sql_physmem_inuse_mb
    ,locked_page_allocations_kb / (1024) AS awe_memory_mb
    ,total_virtual_address_space_kb / (1024) AS max_vas_mb
    ,virtual_address_space_committed_kb / (1024) AS sql_committed_mb
    ,memory_utilization_percentage AS working_set_percentage
    ,virtual_address_space_available_kb / (1024) AS vas_available_mb
    ,process_physical_memory_low AS is_there_external_pressure
    ,process_virtual_memory_low AS is_there_vas_pressure
FROM sys.dm_os_process_memory
GO

The memory clerks will be providing us with the bifurcation of the data in the server. SQL Buffer Pool is also a clerk.
-- Memory Consumption - Clerk-Wise
SELECT *
FROM sys.dm_os_memory_clerks
ORDER BY pages_mb DESC

As we can see buffer pool is consuming a nominal 140 MB , since our VM has just been started.
Now, we execute another query to extract relevant data from the above output which will provide us with the buffer pool utilization by each database.
--Get Buffer pool utilization by each database
SELECT DBName = CASE
        WHEN database_id = 32767
            THEN 'RESOURCEDB'
        ELSE DB_NAME(database_id)
        END
    ,Size_MB = COUNT(1) / 128
FROM sys.dm_os_buffer_descriptors
GROUP BY database_id
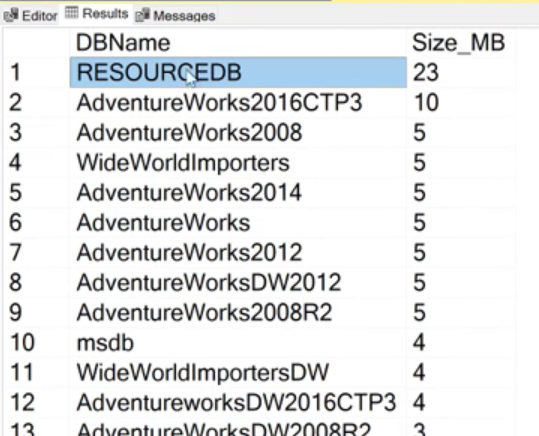
ORDER BY 2 DESC
Upon executing the above query we get a list of how much memory is being consumed by each database. Other than RESOURCEDB (which is a hidden database), we see that the user databases are hardly consuming anything at all.

Next, we can also analyse the buffer pool consumption by each object within a database using the allocation_unit_id. In order to do so we run the next query as shown below.
--Get Buffer pool utilization by each object in a database
USE AdventureWorks2014
GO

SELECT DBName = CASE
        WHEN database_id = 32767
            THEN 'RESOURCEDB'
        ELSE DB_NAME(database_id)
        END
    ,ObjName = o.name
    ,Size_MB = COUNT(1) / 128.0
FROM sys.dm_os_buffer_descriptors obd
INNER JOIN sys.allocation_units au ON obd.allocation_unit_id = au.allocation_unit_id
INNER JOIN sys.partitions p ON au.container_id = p.hobt_id
INNER JOIN sys.objects o ON p.object_id = o.object_id
WHERE obd.database_id = DB_ID()
    AND o.type != 'S'
GROUP BY obd.database_id
    ,o.name
ORDER BY 3 DESC
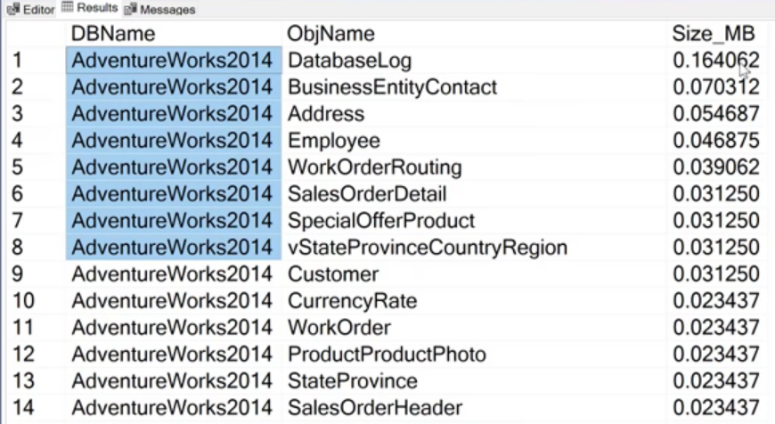
The above query generates the following output where we can see in detail the memory allocation for each object within a given database.

Now, let’s fire up a new query and run select statements on two tables that have a considerable amount of data.
SELECT *
FROM Sales.SalesOrderHeader
SELECT *
FROM Sales.SalesOrderDetail
Upon executing the above two queries, all the pages that are present within these two tables will be fetched from the disk and stored in memory.
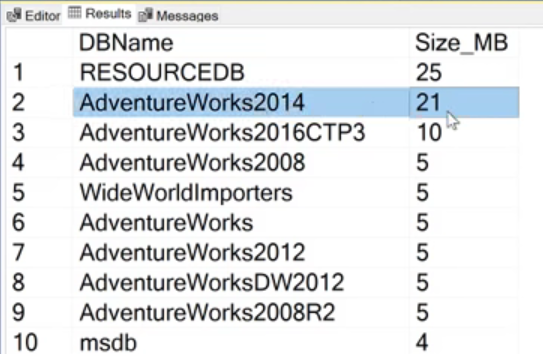
The above two tables reside within the AdventureWorks2014 database as a result of which the memory consumption of AdventureWorks2014 will move higher up the table when we execute the query to check for buffer pool sizes for each database.

As we can see AdventureWorks2014 database has moved up the table in terms of memory consumption is concerned. This demonstrates how memory is getting consumed and mentioned before buffer pool – as a clerk – will be one of the top consumers of memory in SQL Server.
If we re-run the earlier query to obtain the distribution by objects in AdventureWorks2014, we can see that the two tables that we fetched are at the top of the table consuming the most amount of memory.


This makes everything clear now