Hi Friends,
This is based on a forum question and I see many are still confused with SQL Server Query Elapsed Time that you see under Messages tab in SSMS when the session is running with SET STATISTICS TIME ON.
SQL Server Elapsed Time represents the total time the query has taken, in milliseconds, to send the output to the console. And this includes Signal Wait Time, time spent on any Wait Types like PageIOLatch_*, IO_Completion or any other wait type including locking/blocking.
Let me explain with a quick example:
I run the following query:
-- connection 1
use AdventureWorks2012
go

set statistics time on

select * from Person.Person
where BusinessEntityID = 1
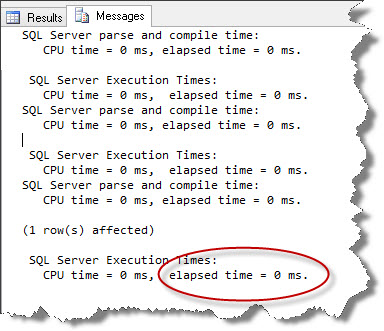
and observe the output:

Elapsed time shows 0 ms – the query ran real quick!
Now, I will purposely introduce a blocking scenario for this query:
I execute this first in another query window (a new session):
-- connection 2
use AdventureWorks2012
go

begin tran
update Person.Person
set FirstName = 'Amit'
where BusinessEntityID=1
and then back to the original session, I execute this, and the query waits:
-- connection 1
use AdventureWorks2012
go

set statistics time on

select * from Person.Person
where BusinessEntityID = 1
After a few seconds, I rollback the transaction in the other query window:
rollback
go
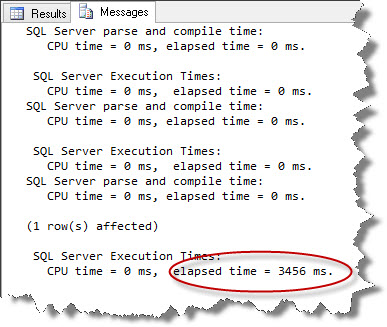
Back to the first query window, let’s check the Messages tab:

This time, the query takes close to 3.5 seconds and it has spent most of its time waiting for the resource to be released which was locked by another transaction.
