Hello Friends,
Query Store, One of the most important feature that was introduced in SQL Server 2016. This is the feature that really help us to troubleshoot query performance related issues. If you want to know more about Query Store basics, then click here. You can learn about execution plan change tracking using Query Store, then click here. In SQL Server 2017, Microsoft added some more power to the Query Store i.e. Wait Stats. From SQL Server 2017, Query Store will also provide us the details about wait related information for execution plan.
There are lots of wait types in SQL Server. Some of them are really very powerful, while some of them are not that much useful to troubleshoot any issue and we generally ignore those kind of wait types. Tracking all the individual wait types will add lot of information for execution plans in Query Store. This will result in using lot of space in query store. To make it simple, Microsoft created groups or categories for similar kind of wait type, for example – CXPACKET and EXCHANGE waits will come under wait category “Parallel”. If you want to know more about these groups, then click here.
Now we will see how we can use wait related information from Query Store. I’ll be using AdventureWorks2016 database on my SQL Server 2017 instance for this post. You can download AdventureWorks database from here. After this enable the query store option as described in one of my previous blog post here. Once Query Store is enabled, execute below queries (To make Query Store and Buffer Clear). Do not run these queries in production.
USE [Master]
GO
ALTER DATABASE [AdventureWorks2016] SET QUERY_STORE CLEAR;
GO
DBCC DROPCLEANBUFFERS();
GO
Now execute below mention Query to generate plan and execution related information for Query Store:
USE [AdventureWorks2016]
GO
SELECT
	SOH.CustomerID,
	SUM(LineTotal)
FROM Sales.SalesOrderDetail SOD
JOIN Sales.SalesOrderHeader SOH
	ON SOD.SalesOrderID = SOH.SalesOrderID
GROUP BY SOH.CustomerID
ORDER BY SUM(LineTotal) DESC
Now Go to Query Store and open “Top resource Consuming Queries”.
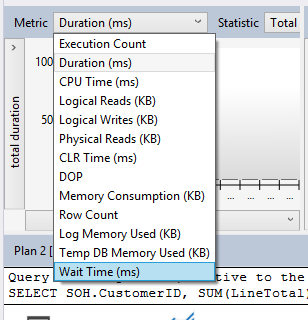
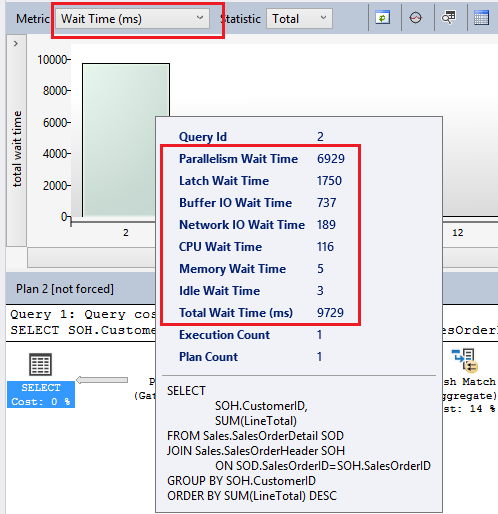
Change Metric from duration to Wait Time (ms) and take mouse pointer over the histogram bar:
Now you can see the wait stats related information for this query execution. You can view this information by using below mention query (this is the query available on msdn):
SELECT
  [ws].[wait_category_desc],
  [ws].[avg_query_wait_time_ms],
  [ws].[total_query_wait_time_ms],
  [ws].[plan_id],
  [qt].[query_sql_text],
  [rsi].[start_time],
  [rsi].[end_time]
FROM [sys].[query_store_query_text] [qt]
JOIN [sys].[query_store_query] [q]
    ON [qt].[query_text_id] = [q].[query_text_id]
JOIN [sys].[query_store_plan] [qp]
    ON [q].[query_id] = [qp].[query_id]
JOIN [sys].[query_store_runtime_stats] [rs]
    ON [qp].[plan_id] = [rs].[plan_id]
JOIN [sys].[query_store_runtime_stats_interval] [rsi]
    ON [rs].[runtime_stats_interval_id] = [rsi].[runtime_stats_interval_id]
JOIN [sys].[query_store_wait_stats] [ws]
    ON [ws].[runtime_stats_interval_id] = [rs].[runtime_stats_interval_id]
    AND [ws].[plan_id] = [qp].[plan_id]
WHERE [rsi].[end_time] > DATEADD(MINUTE, -60, GETUTCDATE())
AND [qt].[query_sql_text] LIKE '%FROM Sales.SalesOrderDetail SOD%' –-Query Filter
AND [ws].[execution_type] = 0
ORDER BY [ws].[avg_query_wait_time_ms] DESC;
Using this wait stats related information in Query Store is really helpful to troubleshoot query performance related information.
HAPPY LEARNING!
Regards:
Prince Kumar Rastogi
Follow Prince Rastogi on Twitter | Follow Prince Rastogi on FaceBook


