Hello Friends,
SQL Server trace flags are important consideration for a query plan compilation and execution. Trace flag can impact the execution of a query and might hit the performance badly if not used appropriately. Sometimes during performance troubleshooting by using execution plan is not easier because we don’t have the information about the trace flags which are enabled on the server. SQL Server 2014 SP2 and SQL Server 2016 onward, this information has been added to the XML plan. That trace flag information will be taken in consideration while doing performance troubleshooting. In this blog post we will take a look about SQL Server Trace Flags Information in Execution Plans. Let me show you the same practically:
DBCC TRACEON(4199,-1);
GO
SET STATISTICS XML ON
GO
SELECT *
FROM Sales.SalesOrderDetail SOD
ORDER BY SOD.ProductID
OPTION (QUERYTRACEON 9471)
GO
SET STATISTICS XML OFF
GO
DBCC TRACEOFF(4199,-1);
GO
In above query, you can see that trace flag 4199 enabled at global level, Actual execution plan enabled using STATISTICS XML ON and trace flag 9471 enabled at query level using QueryTraceON.
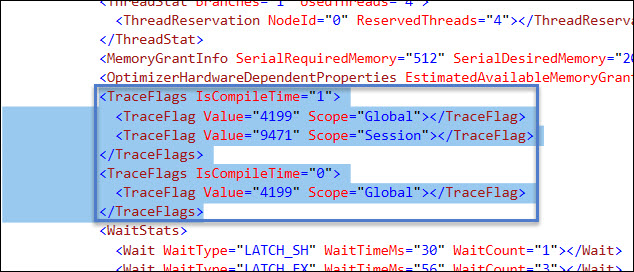
Click on the link to open up the XML plan and search the trace flag section, you will see the enabled trace flag level information:
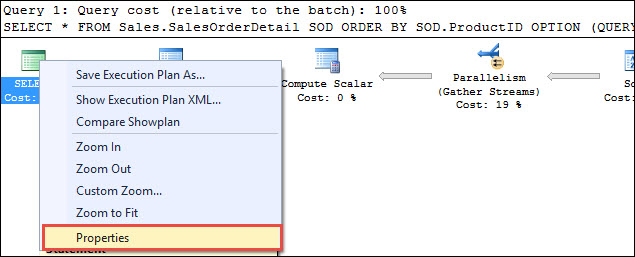
We can easily see that which trace flag is impacting the compilation as well. You will see the same information if you are using the graphical execution plan. Click on the select section of the graphical execution plan and right click on properties:
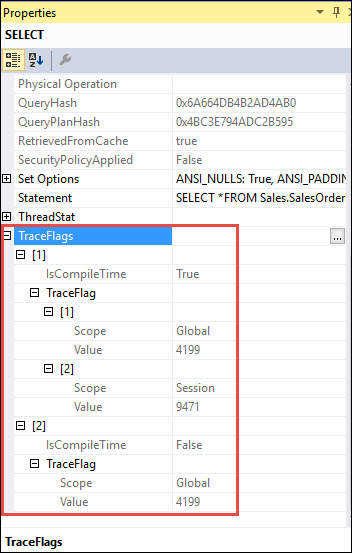
This will open up the properties window in Right hand side and bottom of that windows there will be the trace flag section as mention below:
Reference: Click Here.
HAPPY LEARNING!
Regards:
Prince Kumar Rastogi
Like us on FaceBook | Join the fastest growing SQL Server group on FaceBook
Follow Prince Rastogi on Twitter | Follow Prince Rastogi on FaceBook


