Hi Friends,
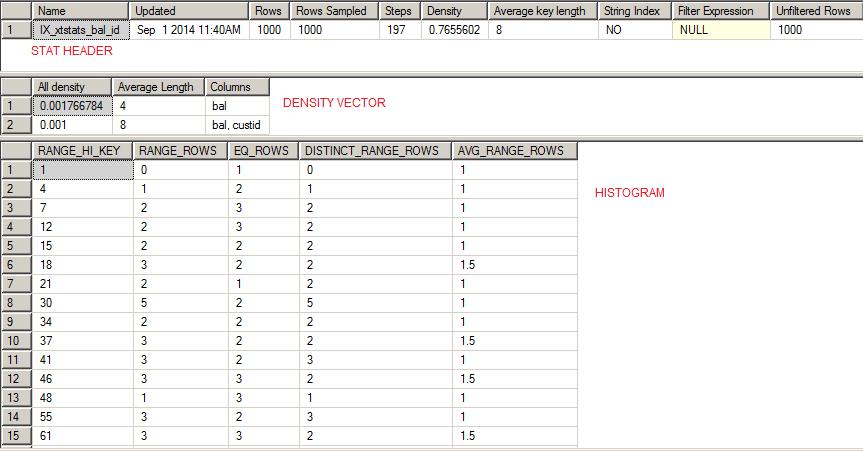
We all know that in SQL Server, resource allocation for a query execution depends on the number of rows to be processed here for number of rows you can say Cardinality Estimation. But how sql server knows about this number of rows to be processed without scanning the tables or indexes before the execution? Actually, SQL Server decides it on the basis of statistics where statistics are like an object which stores the information about data distribution. Each statistics contain three sections Stat Header, Density Vector and Histogram.
1- Header: Contain the information about statistics last update date, sample rows, filtered or not etc.
2- Density Vector: Here it shows the density for some combinations of columns. Which is calculated on the basis of density=1/ distinct number of rows for column(s).
3- Histogram: Here sql server histogram store much more detailed information about data distribution for leading column.
Let me show you this practically.
use master
go
--drop test db if already exist
if DB_ID('STATSTEST') IS NOT NULL
   Drop database STATSTEST;
--create a new test db
create database STATSTEST;
go
use STATSTEST;
go
--create a new table
create table xtstats
(
custid int identity(1000,1),
bal int
)
go
--enter 1000 random values for bal column
insert into xtstats values (RAND()*786)
go 1000
--create a non clustered index on bal as leading column
--it will also create statistics with same name as index
create nonclustered index IX_xtstats_bal_id on xtstats(bal,custid)
go
--check the created stats
DBCC SHOW_STATISTICS('xtstats','IX_xtstats_bal_id')

In the above figure, you can see all the three sections of stats. Let me explain the meaning of each column under histogram:
RANGE_HI_KEY: Values shown under Leading column of stats i.e. bal.
RANGE_ROWS: number of rows falls under that step excluding upper boundary value.
EQ_ROWS: number of rows for upper boundary value.
DISTINCT_RANGE_ROWS: number of distinct rows falls under that step excluding upper boundary value.
AVG_RANGE_ROWS: average number of rows falls under that step excluding upper boundary value.
Now let me run the below query on this table with actual execution plan.
USE STATSTEST
go
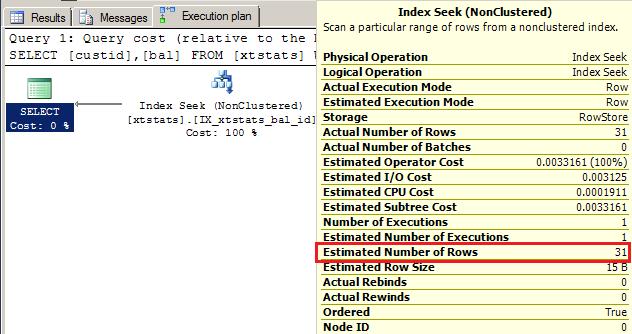
Select custid,bal from xtstats where bal<30

Here estimated numbers of rows have been calculated based on stats histogram. Let me show you.

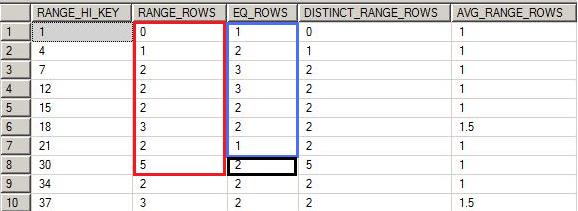
Under that query we select all the rows where bal<30. From histogram we will
1- Select all number of rows under RANGE_ROWS because it represents number of rows falls under that range excluding upper boundary. Highlighted as RED.
2- As specified earlier, RANGE_ROWS will not provide number of rows for upper boundary so we will also add values under EQ_ROWS because it represents number of rows for upper boundary. Highlighted as BLUE.
3- Here, we will exclude the EQ_ROWS (number of rows for upper boundary) for value 30 because we are trying to select columns which fall below 30 only. Highlighted as BLACK.
So RANGE_ROWS= 0 + 1 + 2 + 2 + 2 + 3 + 2 + 5 = 17
EQ_ROWS= 1 + 2 + 3 + 3 + 2 + 2 + 1 = 14
Total = 17 + 14 = 31 which is equals to estimated number of rows.
HAPPY LEARNING!
Regards:
Prince Kumar Rastogi
Like us on FaceBook | Join the fastest growing SQL Server group on FaceBook
Follow Prince Rastogi on Twitter | Follow Prince Rastogi on FaceBook
